
5·
19 days agoThanks, submitted!
Thanks, submitted!
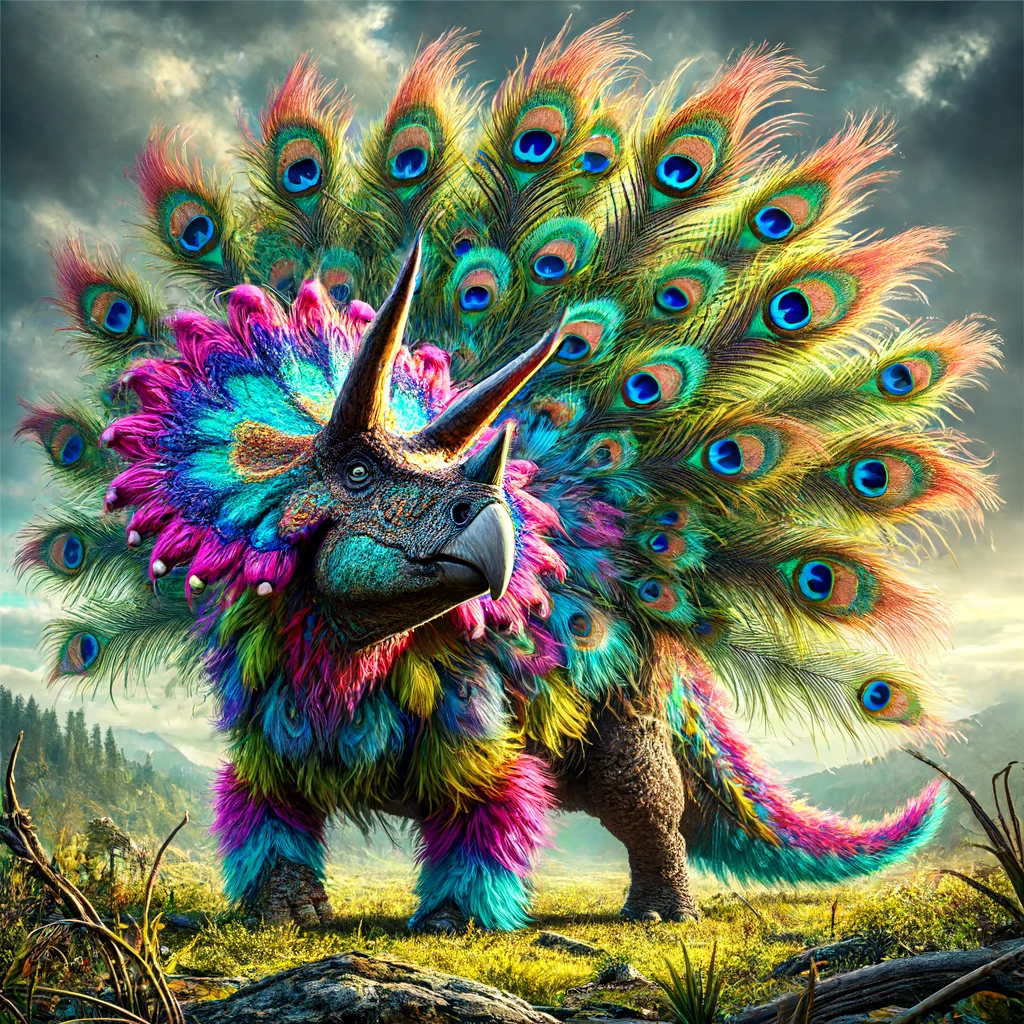
Dino-peacock

Quite relevant indeed!
Definitely include a graph of shareholder value overlayed on top.
Sarcasm aside, maybe we should have a graph that also shows:
And see that by basically all metrics we are working more, paid less, more depressed, more stressed, and unhappy.
Oh no just like in the Hyperion Cantos, THE TUNNELS ARE FILLED WITH BODIES

looks up from soldering a keyboard from scratch like a feral raccoon I’m absolutely not in the middle of countless projects

Ho boy, my mind is a minefield of such topics. I’m compulsively drawn to obsess about new things for a few months and then never think of it again until someone brings it up.
This meme hit me hard, so true.
I don’t get it, help a poor history illiterate out
I’m so here for this story. What happens when they get to the camp?! Do they get a tasty fly soup?
The book “Fall, or Dodge in Hell” has this as a key subplot that people just follow hallucinating meme generating AI feeds untill they are totally brainwashed into doing whatever it hallucinates they should do next
Your comment made me laugh, well done

This is fantastic

The Urge
Well this week starts Inkttober sooo
I’m a fire fighter so I’m used to phone alarms, but this one was a different tone so I was like “holy shit IS THIS THE BIG ONE?” narrator “it was in fact not the big one”
Me too!!! I finally found a place where the outside matches the in. Although once I went on a pretty spooky fire at a big high school and got lost in the basement underneath the stage because I got distracted. That wasn’t cool. To be fair I was following another dude who got us lost, but still. Can’t get distracted when doing search, gotta keep an exit map going at all times. I learned my lesson and no one got hurt.


Huzzah!